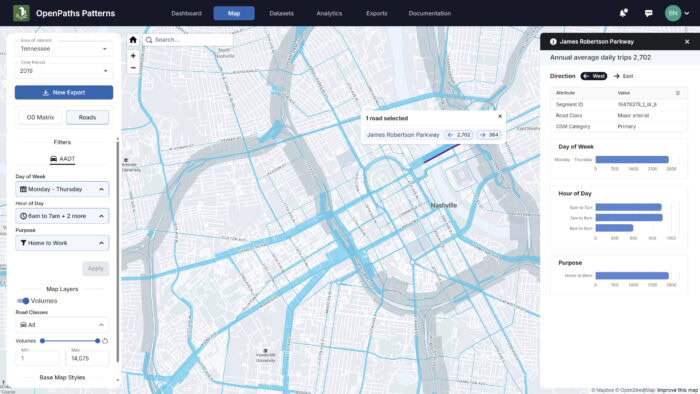
Bentley OpenPaths Patterns is a web-based mobility data and analytics application for transportation analysts to harness the power of big-data for better decision-making. With OpenPaths Patterns, you can mine travel mobility data to understand where, when, and how people travel anywhere in the United States.
OpenPaths Patterns Traffic Volumes and Origin Destination data are delivered to customers via the OpenPaths Patterns web interface. OpenPaths Patterns includes Traffic Volumes and ODs for a single annual average dataset and for enterprise use across all member organizations within a specific state. For each year in the price table, an additional, current year annual average dataset is delivered.
Why Bentley OpenPaths Patterns matters for TETC Members
OpenPaths Patterns is easy to use and intuitive, so that no user is excluded by lack of training. Our comprehensive solution is ready nationwide off-the-shelf, so there is no compute downtime or hidden fees.
Travel Behavior Patterns: OpenPaths Patterns helps DOT’s understand how people move within the state, including origins, destinations, routes, and travel modes. This insight informs decisions about infrastructure investments, public transit routes, and transportation services that align with actual travel patterns.
Demand Analysis: Enables the state DOT to assess transportation demand across different times of day and days of the week. This information supports decisions about capacity enhancements, service frequency adjustments, and targeted investments to address peak travel demand.
Infrastructure Planning: OpenPaths Patterns aids in identifying areas where new transportation infrastructure is needed. Based on actual usage data, it helps the DOT prioritize constructing or expanding roads, highways, bridges, and public transit systems.
Policy Evaluation: OpenPaths Patterns data enables DOT‘s to evaluate the effectiveness of existing policies, initiatives, and transportation projects. By measuring travel patterns and behavior changes, the DOT can make informed data-driven adjustments to improve outcomes.
Long-Term Planning: OpenPaths Patterns can contribute to developing long-term transportation plans by providing historical data on travel trends. This data helps the DOT anticipate future transportation needs and prioritize investments accordingly.
“[We] completed an OD Key Bridge flow analysis using ZIP codes. The analysis will assist BMC staff in responding to policy board questions on how many, what location, and what travel is impacted. The software was flexible, allowing BMC staff to upload geography (zip codes), identify a gate (Key Bridge), and capture/display OD flows.”