Home / Asset Analytics / iTwin IoT | Asset Analytics

iTwin IoT | Asset Analytics

Unlock the Power of Real-Time Infrastructure Monitoring

Discover How iTwin IoT Transforms Infrastructure Oversight With Live Sensor Data And 3D Visualization.

From aging dams to remote mine sites and expansive transportation networks, maintaining infrastructure safety and performance has never been more critical, or more complex. iTwin IoT brings all your sensor data into a single, intelligent platform, giving you the clarity, control, and confidence to monitor assets in real time.

In this new interactive tour, you’ll learn how iTwin IoT helps you:

  • Continuously monitor structural and geotechnical health
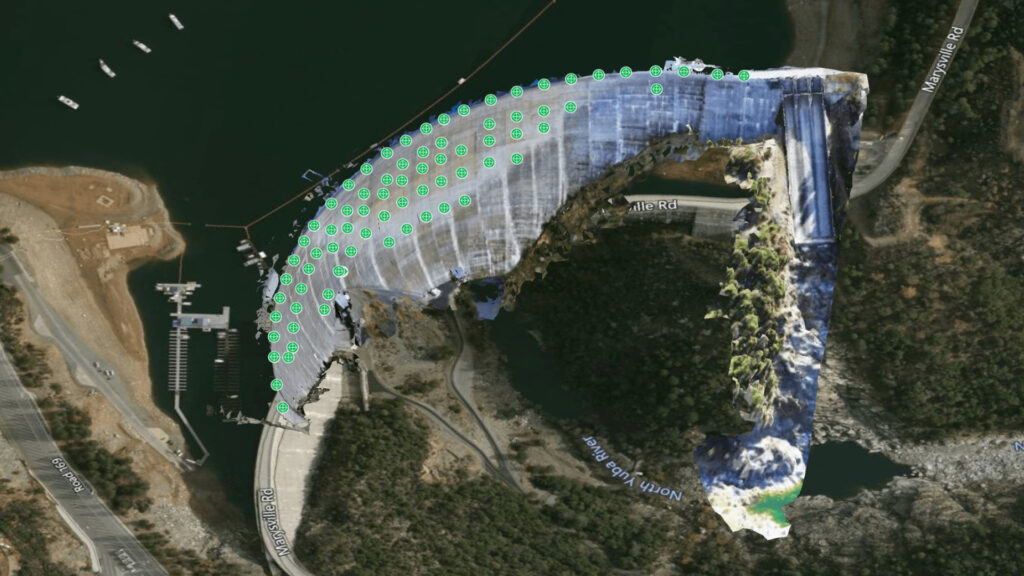
  • Visualize data in 3D/4D for greater spatial insight
  • Receive automated alerts to act before risks escalate
  • Unify sensor data from any vendor or device
  • Support compliance through automated reporting and data logs
  • Improve maintenance planning and reduce operational costs

Whether you’re managing critical transportation routes, monitoring mine stability, or overseeing dam safety, iTwin IoT helps you shift from reactive to proactive infrastructure management—backed by data you can trust.

New Bullards Bar Dam Case Study

See how Bentley’s iTwin Applications for Situational Intelligence Significantly Improves Risk Assessment

A large dam with water flowing over it is shown above text about Yuba Water Agency automating dam monitoring using Bentley’s iTwin IoT applications and Asset Analytics to improve public safety and risk assessment.

Key Highlights:

Project Delivery Icon

Integrated Sensor Data

Aggregate real-time data from piezometers, inclinometers, extensometers, radar, lidar, and more—regardless of vendor.

Icon Learning

3D/4D Visualization

Overlay live sensor data on a digital twin for spatial awareness and predictive insight.

Black outline of a computer chip with "AI" in the center and circuit lines extending outward on a light background, inspired by Bentley OpenUtilities Substation+ Early Access Program.

Automated Alerts

Set thresholds to trigger real-time alerts for movement, pressure, water levels, and other critical values.

A simple line drawing of a computer screen displaying a bar chart and a pie chart.

Remote, Scalable Monitoring

Access asset performance data from anywhere—ideal for distributed networks and hard-to-reach locations.

Simple black and white line drawing of a person with long hair wearing a headset with a microphone, suggesting a customer service or call center representative.

Regulatory & Audit Support

Automated data logging, historical trend analysis, and customizable reports support FERC, ICOLD, MSHA, DOT, and more.

Black and white icon showing a bar chart with three vertical bars, a connected line graph above, and a dashed semicircle arching over both.

Improved Maintenance and Risk Planning

Use historical trends and predictive data to prioritize interventions, optimize budgets, and prevent failure.

Questions? Ready to buy? Chat with an expert today and book a demo!

Aerial view of a dam with numerous green markers, enhanced by iTwin IoT Asset Analytics, along its curved top edge, surrounded by roads, water, and trees.