

OCT 07, 2025
The Case of the Missing Pump Energy Budget
Tom Walski, Ph.D, P.E, Industry Analyst and Bentley Fellow
In This Story
- Inefficient pumps silently steal from utility budgets
- Data reveals clues that pumps won't confess
- Digital tools turn waste into savings
Pump Efficiency Matters.
You lock your car and put your valuables in a safe to keep out thieves. But if you operate a water or wastewater system, you may have a thief in your organization silently stealing from you every day. I'm talking about the pumps in your pump stations. They look innocent enough, but a few of them are taking extra money out of your utility's wallet each day and sending it off to the power company. How do you find this culprit and put an end to this stealing? We have some tips.
Which Pump is Wasting Energy?
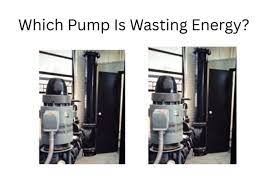
Pumps and the systems they interact with are complicated, so there are many ways they could be wasting energy. The offending pump won't tap you on the shoulder so you wish to end out, 'Stop me before I steal again.' Utilizing advancements in technology and further developments in water digitization, solutions are emerging. So put on your detective badge and start investigating. Inefficient pumps are pretty sneaky, and they have clues. Centrifugal pumps do not run at a constant outflow—their output can vary as operating conditions change over time, sometimes even minute to minute. When the pump was new, this relationship was known and could be represented on a pump efficiency curve. (Efficiency curves are one of four curves that characterize pump performance.) Ideally, you want to be running at the highest point on the pump efficiency curve, which is called the Best Efficiency Point. That's the blue point on the curve.
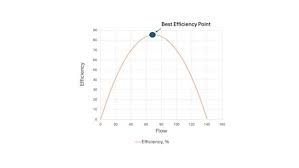
But these changes over time due to varying demands, tank water level fluctuations, piping changes, and valve settings.
The curves themselves can also change due to wear, poor tolerance adjustment, and bearing failure, among other things.
Interpreting Your Clues
To identify the bad pumps, you can wait until the pump makes horrible sounds or appears to want to vibrate itself to death. But by then, you've already wasted a lot of money. You need data, which you can find in your SCADA System (Supervisory Control and Data Acquisition) or in other Internet of Things (IoT) devices. This data is stored in your historian, a piece of software that collects and stores data about pressures, flow rates, and other information.
First look for spots where the pumps no longer perform on their pump curves. Discrepancies between the curves and the actual pump data typically reveal problems with the pumps themselves. If you're lucky, a mechanic can correct these problems in an hour. But the issues may require major rehabilitation of the pump, or they may even be a sign that the pump is ready for the junkyard (or an antique museum). To identify problems, look for pump data that doesn't fall on the expected curves. These are the purple points below.
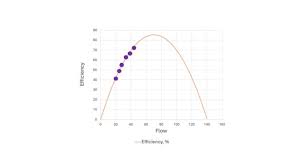
Even if a pump is operating on its desired curve, you may still find problems when it isn't operating near its best efficiency point. The actual operating point depends not only on the pump, but on the entire system. And there are numerous possible reasons for the problem. The engineer who selected the pump may have made inaccurate assumptions about future development in the service area. Pipe sizes and the elevation of water tanks may have been set standard yet. Operational problems, such as an operator simply setting a value that should be open, a leak, or pumps that are designed to fill a system (or air collecting at a high point where an air release valve should have been installed to keep the air bubble from clogging the pipe; [in wastewater systems, the "air" is actually a nasty mixture of gases]).
The pump data below shows a pump that is operating on its curve but not at a good point.
But that's not enough complexity; consider that the problems differ depending on whether the pumps are discharging into an open or closed system. An open system would have an elevated water tank for a water system, or a manhole in the case of a wastewater system. A closed system has no such free surface and is more difficult because the pumps in utilities must continuously meet instantaneous demands. Closed systems can rely on tanks and wet wells to dampen out fluctuations.
If there is a problem, you may face a critical decision: Replace the pump? Repair it? Or survive with it? You must look at the life-cycle costs for the pumps, which include equipment and labor. But the largest cost item is energy—and unfortunately, energy cost is the most difficult to accurately calculate.
In the past, calculating the energy cost of pumps over time was a tedious and challenging process. This led to shortcuts and assumptions that reduced the accuracy of cost estimates. With the advent of digitization, computers have relieved engineers of the tediousness of this work.
Calculating Energy Costs
The friendly equation below underlies the cost calculation. Don't worry, you don't need to manually solve the equation (unless you feel like it) because software like Bentley Systems' OpenFlows Water and WaterGEMS can do it in a few mouse clicks.
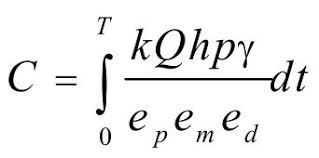
Where:
- C = cost of energy over some time T
- Q = flow
- h = pump head
- p_t = unit price of energy
- γ = specific weight of water
- e_p = efficiency of pump
- e_m = efficiency of motor
- e_d = efficiency of drive
- k = unit conversion factor
Clues for Energy Saving
The terms in the equation provide some tips for reducing energy costs. You want to reduce the terms in the numerator (the top of the fraction) and increase the terms in the denominator (the bottom). Flow (Q) can be reduced by water conservation, leak reduction, or possibly reorganizing pressure zone boundaries to ensure you don't over-pressure neighborhoods. To reduce h, you can use bigger pipes, open throttle valves, eliminate air blockage, clean rough or blocked pipes, avoid inefficient pump combinations, or lower the water level in proposed tanks. Each of these remedial measures has a cost that needs to be compared with the energy savings it produces. (You can't do much to control the specific weight of water. Even the best software can't make water lighter.)
In the denominator, correct pump selection and operation can keep the pump operating near its efficiency point. Motor efficiency can be improved by using high and premium efficiency motors (at a cost). The efficiency of a variable speed drive (if you use one) depends on how it's programmed.
Actual Energy Price
It's possible to reduce energy use but have minimal or negative effects on energy costs. This is where the unit price of energy (p) comes in. Calculating the cost of energy is not as simple as reading your water bill, which is usually just quantity purchased multiplied by unit price of water (gallons times dollar per gallon). There are many factors that affect energy pricing, such as time-of-day pricing, seasonal pricing, block rate pricing, and demand charges.
For large-power users, pricing is spelled out in a tariff document that contains the rules for how the utility bills the user. Such a tariff document is seldom less than 20 pages, but the documents include a page that spells out pricing. Somebody in the utility has it in their files. If you can't find it, the power company will be happy to send you a copy.
The tariff gives you clues as to how you can save money. For example, if the price of energy increased between 3 p.m. and 8 p.m. on weekdays in the summer, you need to reduce your pumping during that time by making sure your tanks are relatively full at 3 p.m. so you can minimize pumping. Unlike water utilities, which can store water (and thus energy) in tanks, power companies need to meet instantaneous and maximum demands. They must size their infrastructure to meet those peaks. One strategy is to make users pay more for energy during peak times.
These charges, which can vary widely among power companies, are based on some measure of peak power demand, such as the peak hourly demand during the air conditioning season. If the peak is volume demand between 3 p.m. and 8 p.m. the problem with demand charges is that once they are achieved, they stay on the bill for multiple billing periods unless they are exceeded.
It's important to understand the situation that resulted in the peak demand you're paying for. Was it a major pipe break, a questionable operator decision, or maybe a large fire? (Fire fighters have other things on their mind besides saving energy.)
Clues from your energy bill
Have you ever looked over your energy bill? Find it and review it. Usually somebody in the accounting department pays the energy bills, so they're not always shown to water utility managers. The operator thinks someone in accounts payable looks it over and, as long as it's within budget, pays it. The operators and engineers who can affect these costs rarely see them; if ever, review them.
Modern hydraulic analysis software can calculate what the bill should be. If there are differences between the bill and the model, the source of those differences needs to be investigated. This may lead to poor decisions on when to turn pumps on and off or operating incompatible pumps at the same time. Maybe the model isn't set up the way that operators really make decisions. These differences need to be diagnosed and resolved.
Realizing (or not) Energy Cost Savings
Walking into a pump station is a bit like walking into a gold mine. Little nuggets of energy gold are usually lying just below the surface. You just need to do some digging to find them.
If looking for energy saving is such a huge opportunity, why don't utilities spend more resources looking for savings? Part of the problem is that no one gets fired for wasting energy. The power company is very happy to take your money.
Utilities are very interested in saving energy and money. Someone is usually tasked with achieving those savings. If after several months, you ask the individual how their energy study is going, the response may be something like, "I started working on it. But I got pulled off to buy those replacement parts, then I had to prepare the briefing for the mayor, and I needed to hire a contractor to repair the South Street Tank." Meanwhile, money that could have gone to other beneficial uses goes out the door.
Energy study tools make it easier to perform an energy savings analysis. If you look for energy savings, you'll find them.
Read more of Tom’s blogs here, and you can contact him at: tom.walski@bentley.com.